In order to use this feature, the programmer must open an adapter and put it in statistical mode. This can be done with pcap_setmode(). In particular, MODE_STAT must be used as the mode argument of this function.
With statistical mode, making an application that monitors the TCP traffic load is a matter of few lines of code. The following sample shows how to do it.
/*
 * Copyright (c) 1999 - 2005 NetGroup, Politecnico di Torino (Italy)
 * Copyright (c) 2005 - 2006 CACE Technologies, Davis (California)
 * All rights reserved.
 *
 * Redistribution and use in source and binary forms, with or without
 * modification, are permitted provided that the following conditions
 * are met:
 *
 * 1. Redistributions of source code must retain the above copyright
 * notice, this list of conditions and the following disclaimer.
 * 2. Redistributions in binary form must reproduce the above copyright
 * notice, this list of conditions and the following disclaimer in the
 * documentation and/or other materials provided with the distribution.
 * 3. Neither the name of the Politecnico di Torino, CACE Technologies
 * nor the names of its contributors may be used to endorse or promote
 * products derived from this software without specific prior written
 * permission.
 *
 * THIS SOFTWARE IS PROVIDED BY THE COPYRIGHT HOLDERS AND CONTRIBUTORS
 * "AS IS" AND ANY EXPRESS OR IMPLIED WARRANTIES, INCLUDING, BUT NOT
 * LIMITED TO, THE IMPLIED WARRANTIES OF MERCHANTABILITY AND FITNESS FOR
 * A PARTICULAR PURPOSE ARE DISCLAIMED. IN NO EVENT SHALL THE COPYRIGHT
 * OWNER OR CONTRIBUTORS BE LIABLE FOR ANY DIRECT, INDIRECT, INCIDENTAL,
 * SPECIAL, EXEMPLARY, OR CONSEQUENTIAL DAMAGES (INCLUDING, BUT NOT
 * LIMITED TO, PROCUREMENT OF SUBSTITUTE GOODS OR SERVICES; LOSS OF USE,
 * DATA, OR PROFITS; OR BUSINESS INTERRUPTION) HOWEVER CAUSED AND ON ANY
 * THEORY OF LIABILITY, WHETHER IN CONTRACT, STRICT LIABILITY, OR TORT
 * (INCLUDING NEGLIGENCE OR OTHERWISE) ARISING IN ANY WAY OUT OF THE USE
 * OF THIS SOFTWARE, EVEN IF ADVISED OF THE POSSIBILITY OF SUCH DAMAGE.
 *
 */

#include <stdlib.h>
#include <stdio.h>

#include <pcap.h>

void usage();

void dispatcher_handler(u_char *, const struct pcap_pkthdr *, const u_char *);


void main(int argc, char **argv)
{
pcap_t *fp;
char errbuf[PCAP_ERRBUF_SIZE];
struct timeval st_ts;
u_int netmask;
struct bpf_program fcode;

    /* Check the validity of the command line */
    if (argc != 2)
    {
        usage();
        return;
    }

    /* Open the output adapter */
    if ( (fp= pcap_open(argv[1], 100, PCAP_OPENFLAG_PROMISCUOUS, 1000, NULL, errbuf) ) == NULL)
    {
        fprintf(stderr,"\nUnable to open adapter %s.\n", errbuf);
        return;
    }

    /* Don't care about netmask, it won't be used for this filter */
    netmask=0xffffff;

    //compile the filter
    if (pcap_compile(fp, &fcode, "tcp", 1, netmask) <0 )
    {
        fprintf(stderr,"\nUnable to compile the packet filter. Check the syntax.\n");
        /* Free the device list */
        return;
    }

    //set the filter
    if (pcap_setfilter(fp, &fcode)<0)
    {
        fprintf(stderr,"\nError setting the filter.\n");
        pcap_close(fp);
        /* Free the device list */
        return;
    }

    /* Put the interface in statstics mode */
    if (pcap_setmode(fp, MODE_STAT)<0)
    {
        fprintf(stderr,"\nError setting the mode.\n");
        pcap_close(fp);
        /* Free the device list */
        return;
    }


    printf("TCP traffic summary:\n");

    /* Start the main loop */
    pcap_loop(fp, 0, dispatcher_handler, (PUCHAR)&st_ts);

    pcap_close(fp);
    return;
}

void dispatcher_handler(u_char *state, const struct pcap_pkthdr *header, const u_char *pkt_data)
{
    struct timeval *old_ts = (struct timeval *)state;
    u_int delay;
    LARGE_INTEGER Bps,Pps;
    struct tm *ltime;
    char timestr[16];
    time_t local_tv_sec;

    /* Calculate the delay in microseconds from the last sample. */
    /* This value is obtained from the timestamp that the associated with the sample. */
    delay=(header->ts.tv_sec - old_ts->tv_sec) * 1000000 - old_ts->tv_usec + header->ts.tv_usec;
    /* Get the number of Bits per second */
    Bps.QuadPart=(((*(LONGLONG*)(pkt_data + 8)) * 8 * 1000000) / (delay));
    /*                                            ^      ^
                                                  |      |
                                                  |      |
                                                  |      |
                         converts bytes in bits --       |
                                                         |
                    delay is expressed in microseconds --
    */

    /* Get the number of Packets per second */
    Pps.QuadPart=(((*(LONGLONG*)(pkt_data)) * 1000000) / (delay));

    /* Convert the timestamp to readable format */
    local_tv_sec = header->ts.tv_sec;
    ltime=localtime(&local_tv_sec);
    strftime( timestr, sizeof timestr, "%H:%M:%S", ltime);

    /* Print timestamp*/
    printf("%s ", timestr);

    /* Print the samples */
    printf("BPS=%I64u ", Bps.QuadPart);
    printf("PPS=%I64u\n", Pps.QuadPart);

    //store current timestamp
    old_ts->tv_sec=header->ts.tv_sec;
    old_ts->tv_usec=header->ts.tv_usec;
}


void usage()
{

    printf("\nShows the TCP traffic load, in bits per second and packets per second.\nCopyright (C) 2002 Loris Degioanni.\n");
    printf("\nUsage:\n");
    printf("\t tcptop adapter\n");
    printf("\t You can use \"WinDump -D\" if you don't know the name of your adapters.\n");

    exit(0);
}
Before enabling statistical mode, the user has the option to set a filter that defines the subset of network traffic that will be monitored. See the paragraph on the Filtering expression syntax for details. If no filter has been set, all of the traffic will be monitored.
Once
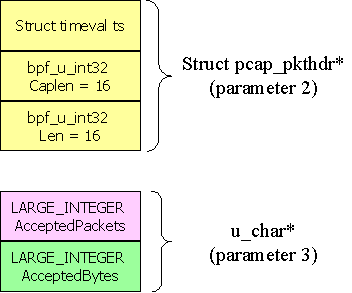
the interface descriptor starts to work in statistical mode. Notice the fourth parameter (to_ms) of pcap_open(): it defines the interval among the statistical samples. The callback function receives the samples calculated by the driver every to_ms milliseconds. These samples are encapsulated in the second and third parameters of the callback function, as shown in the following figure:

Two 64-bit counters are provided: the number of packets and the amount of bytes received during the last interval.
In the example, the adapter is opened with a timeout of 1000 ms. This means that dispatcher_handler() is called once per second. At this point a filter that keeps only tcp packets is compiled and set. Then pcap_setmode() and pcap_loop() are called. Note that a struct timeval pointer is passed to pcap_loop() as the user parameter. This structure will be used to store a timestamp in order to calculate the interval between two samples. dispatcher_handler()uses this interval to obtain the bits per second and the packets per second and then prints these values on the screen.
Note finally that this example is by far more efficient than a program that captures the packets in the traditional way and calculates statistics at user-level. Statistical mode requires the minumum amount of data copies and context switches and therefore the CPU is optimized. Moreover, a very small amount of memory is required.
![]() documentation. Copyright (c) 2002-2005 Politecnico di Torino. Copyright (c) 2005-2007
CACE Technologies. All rights reserved.
documentation. Copyright (c) 2002-2005 Politecnico di Torino. Copyright (c) 2005-2007
CACE Technologies. All rights reserved.